Helping top Fortune 500 managers understand better their data
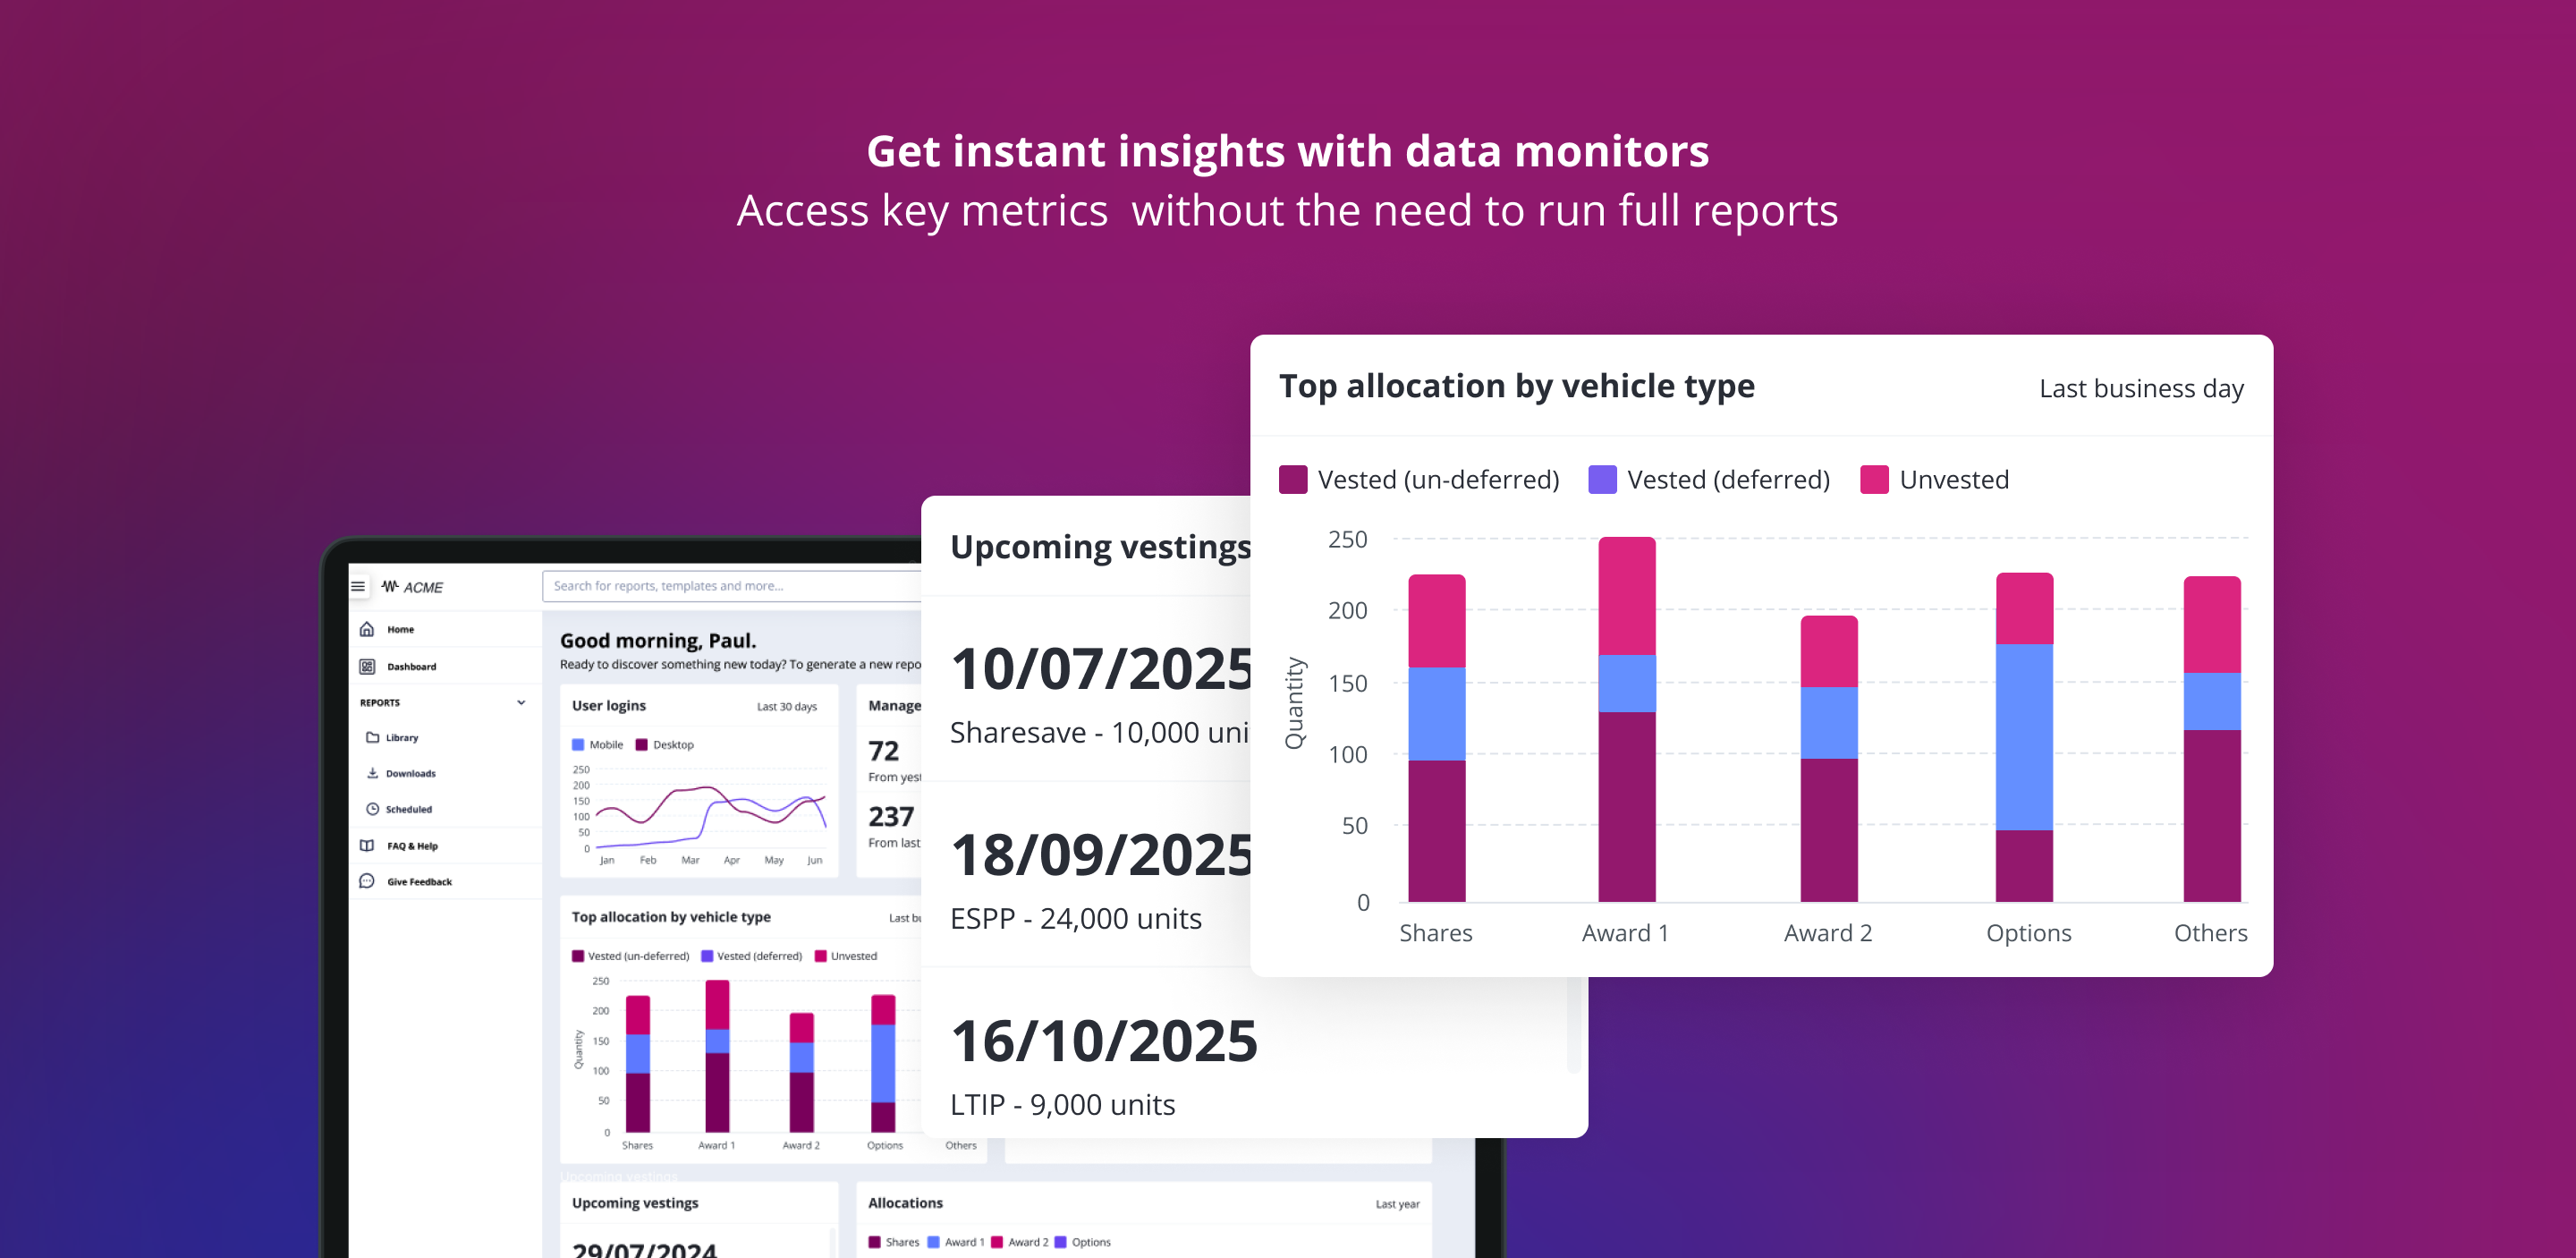
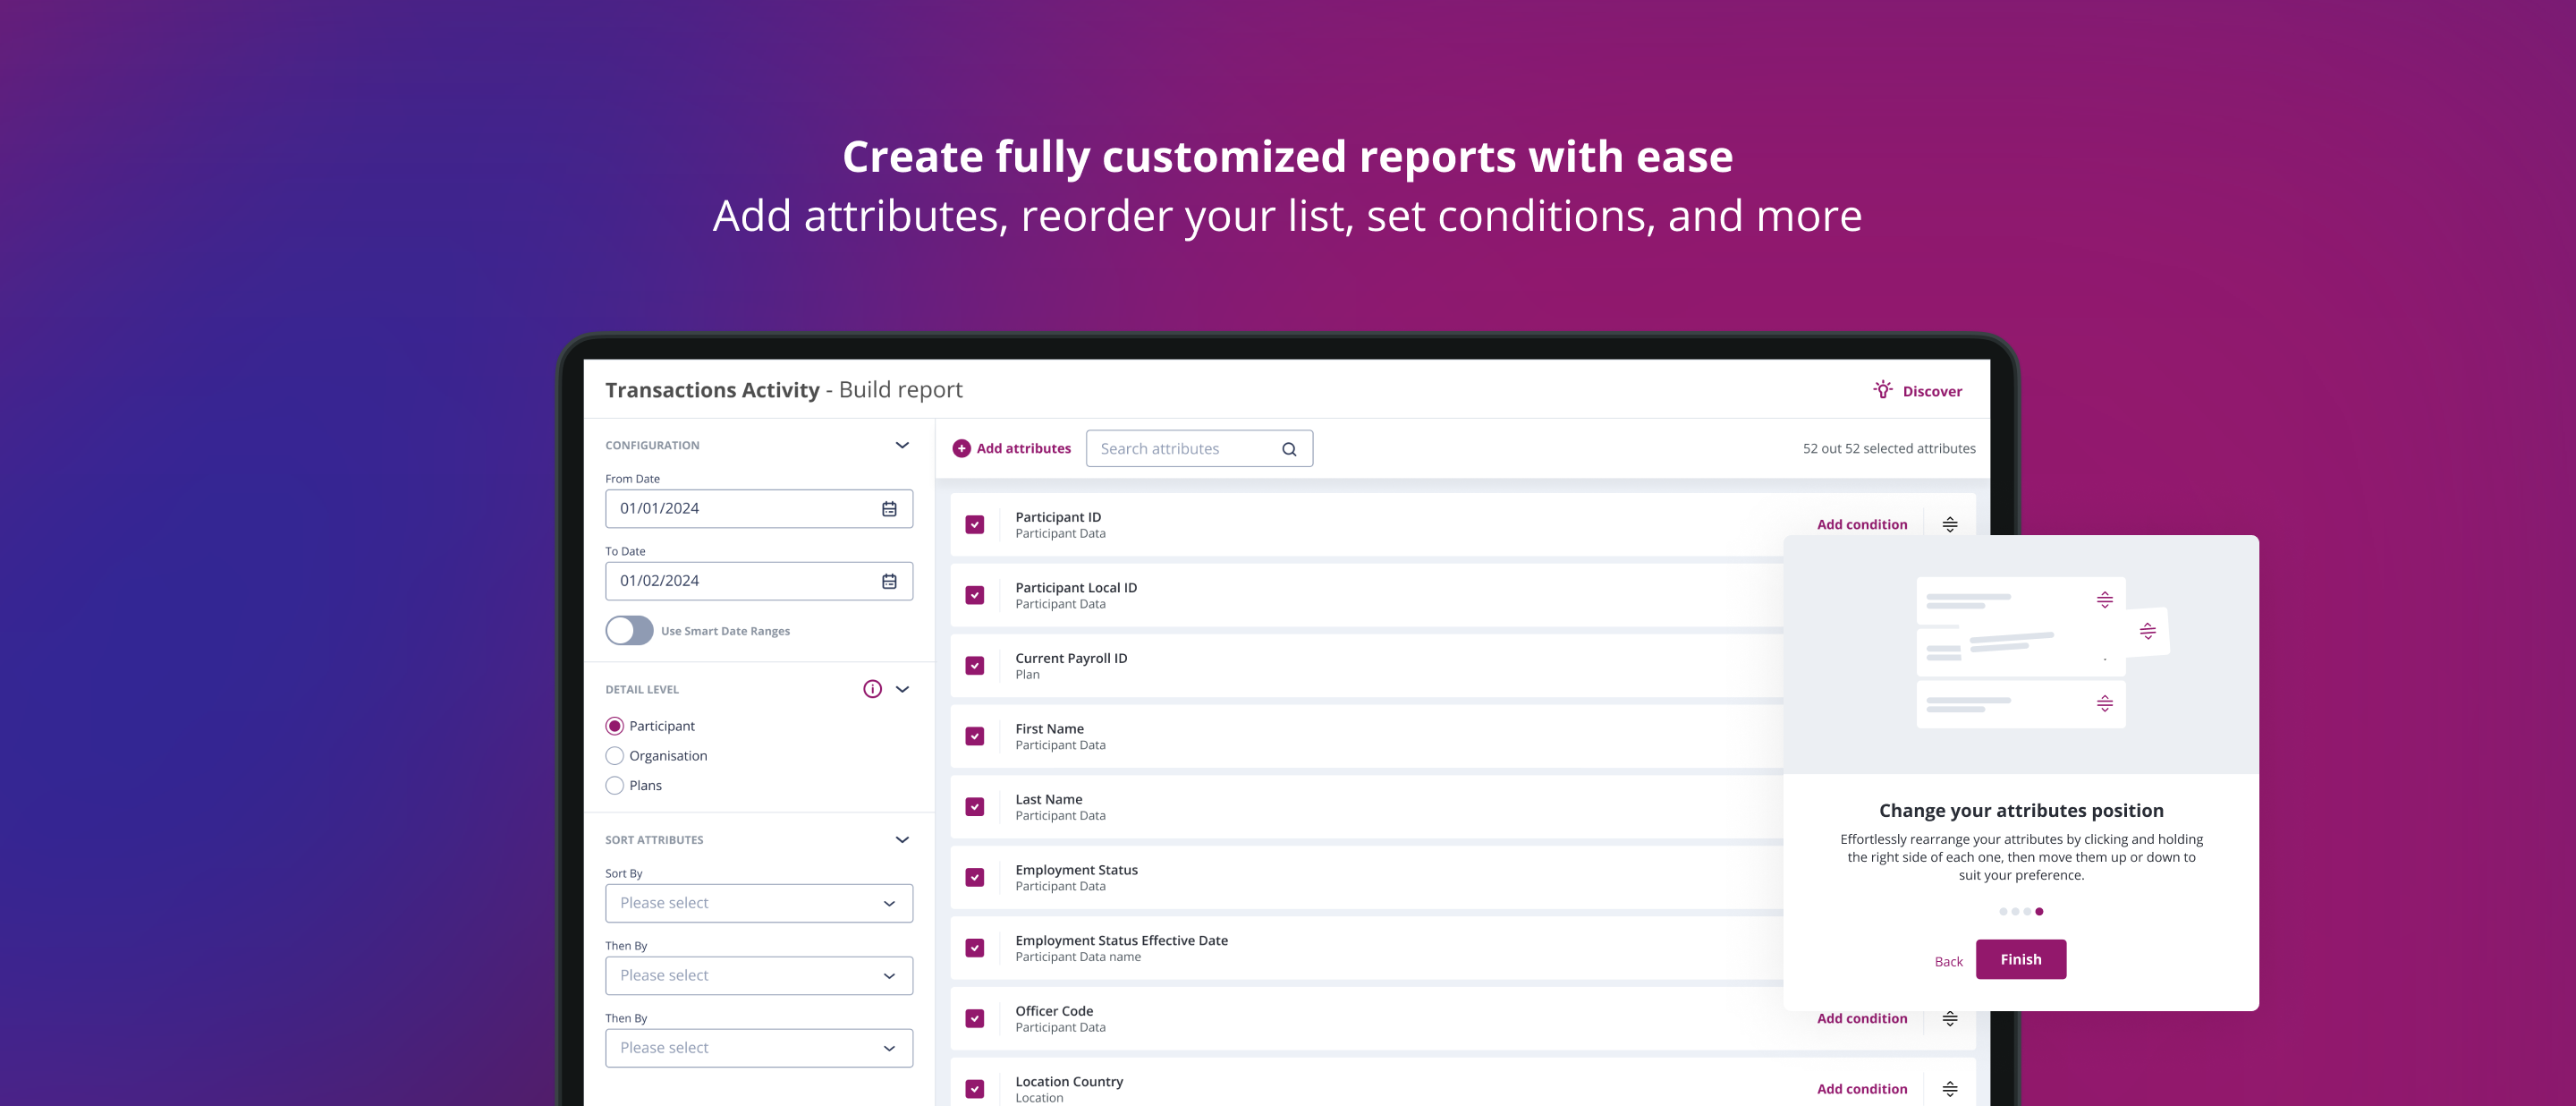
I led the redesign of a high-impact global reporting platform, now used by over 10,000 users across 800 clients, including top Fortune 500 companies. Collaborating with a global Agile team, from concept to launch, ensuring an intuitive and efficient reporting experience that significantly boosted user satisfaction.
Beyond UI/UX work I also created a decision framework for prioritisation, advocated solutions to executives and stakeholders and generated feedback reports to ensure team alignment.
The impact
- 40% increase in user satisfaction (CSAT)
- Time-on-task on daily tasks improved by 80%
- Reports discoverability and accessibility improved by 73%
581
Screens designed
4 years
Project duration
10,000+
Users impacted
17
Usability tests made
40+
Clients interviewed
300+
Feedbacks received

Context
Equatex (part of Computershare) supports companies in managing incentive schemes worldwide. However, as client demand for transparency has grown, Equatex’s reporting solutions have lagged behind, relying on labor-intensive, custom reports that are costly to maintain.
Problem
Equatex’s clients experience frustration with an inflexible and complex reporting system, resulting in low user satisfaction and heavy reliance on support. This lack of self-sufficiency drives up internal costs and hinders Equatex’s ability to deliver a streamlined, scalable solution.
Challenge
Redesign Equatex’s reporting solution to address core business and user needs by creating a more intuitive, flexible, and efficient platform.
The goals for my team were clear:
- Improve client self-sufficiency and satisfaction
- Reduce operational costs and maintenance overhead
- Enhance Equatex’s reputation as a leader in plan intelligence solutions
- Open new revenue opportunities by expanding data service offerings

Design process
Here’s just a glimpse of the highlights—there’s much more beneath the surface. If you’re curious to dive deeper, I’d be happy to share more. Let’s connect!
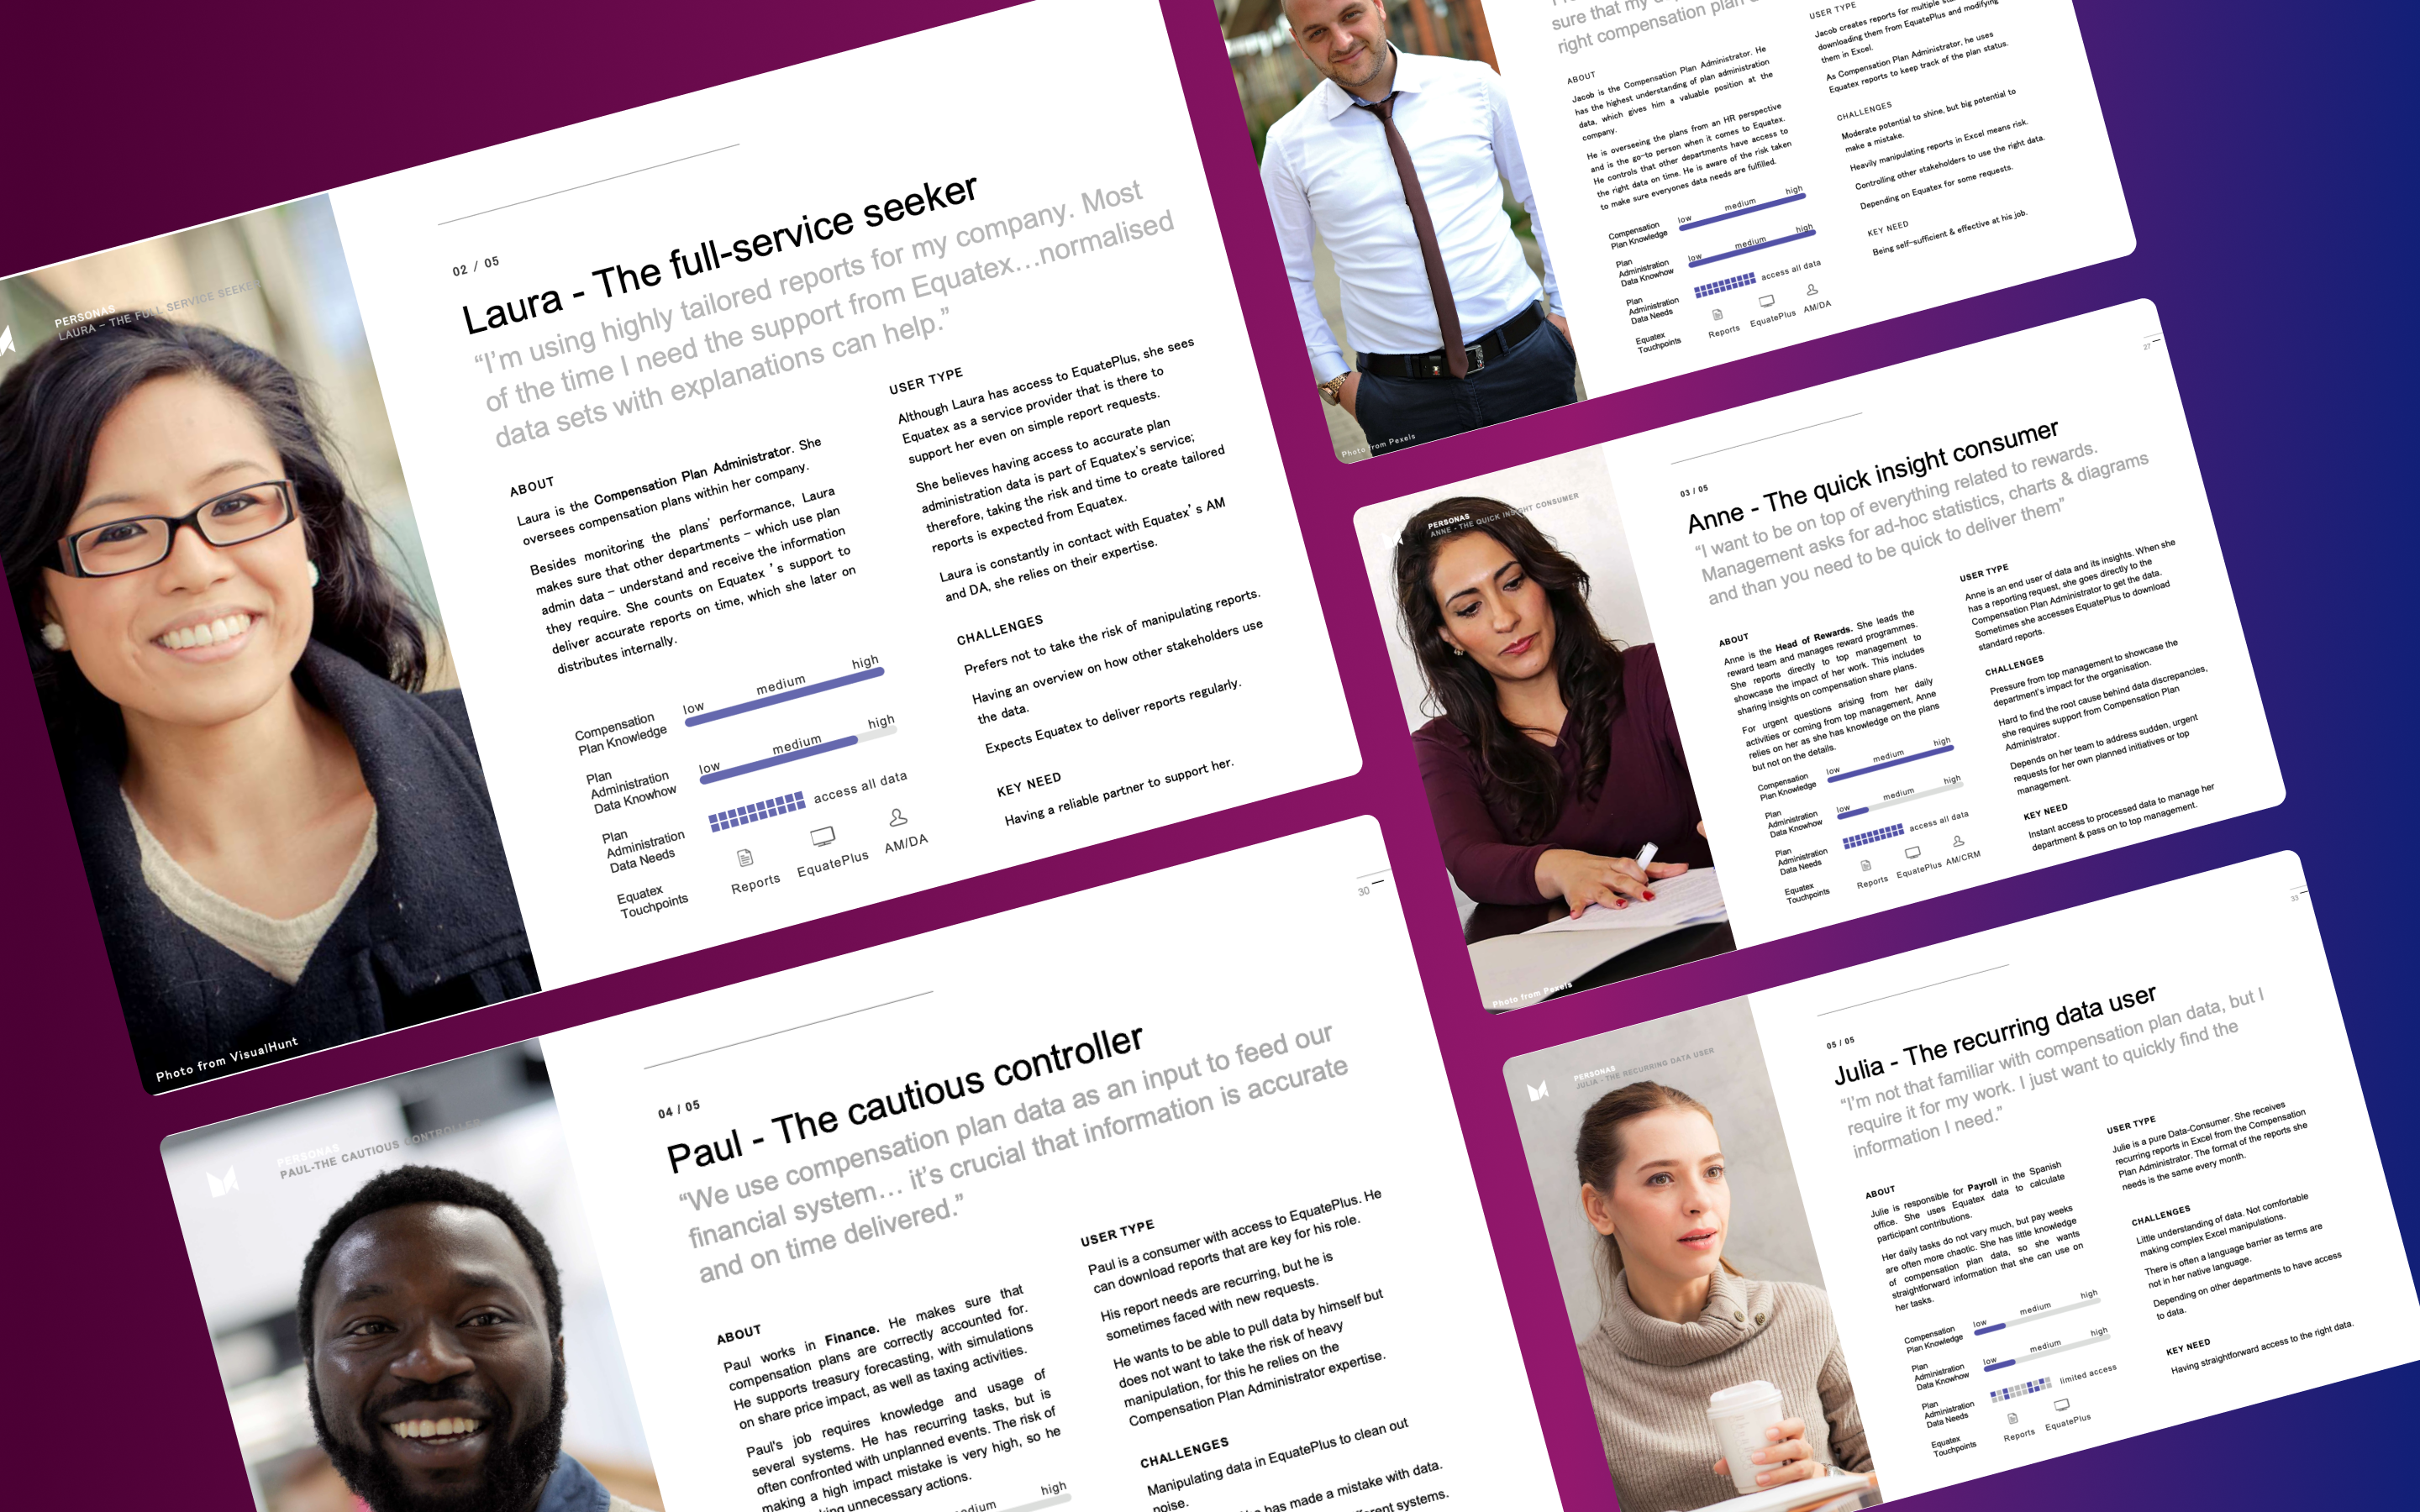
- Discovery Phase: Mapped out current workflows, identified pain points, and defined clear user personas to inform the design direction.
This phase uncovered opportunities to automate processes and create a more intuitive experience. - Ideation & Design: Developed multiple prototypes to explore different approaches, gathering feedback from clients and stakeholders.
Used design systems and component libraries to ensure consistency and streamline development. - Testing & Validation: Conducted A/B testing and usability sessions with clients to validate design choices.
The feedback gathered helped fine-tune interactions, improve data visualization, and enhance report discoverability.


The craft
After a hard work building the design system, I transitioned into the next critical phase: revisiting all research artifacts to plan and prioritize the design backlog. With a clear strategy in mind, I began from the ground up, refining key foundational elements such as the sitemap, navigation structure, and user flows.
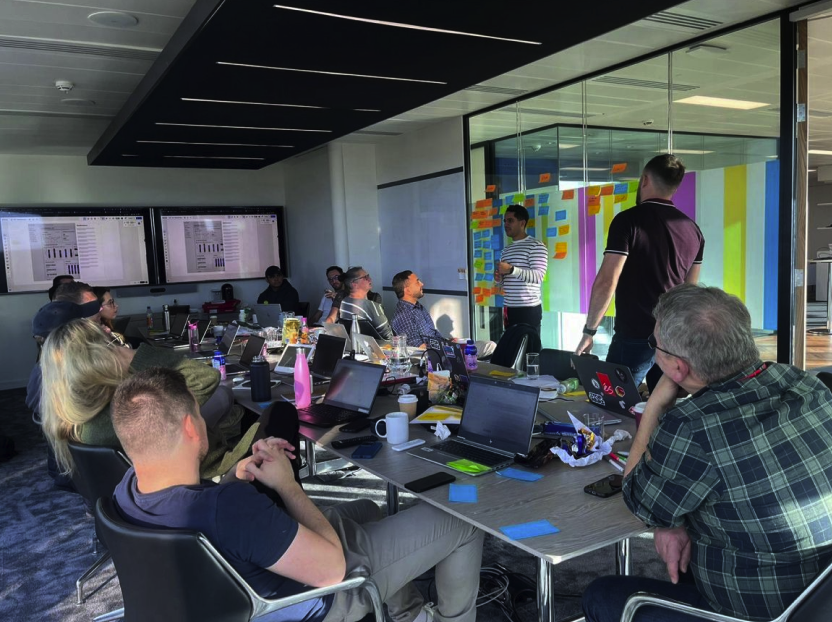
This process followed a structured design approach, starting with information architecture refinement, followed by detailed wireframing and prototyping phases. Each design iteration was validated through continuous feedback loops with both Business and IT stakeholders to ensure alignment with user needs and business objectives.
Over the course of six months, we moved through various design stages, from low-fidelity prototypes to high-fidelity designs, iterating based on feedback and user testing.
The culmination of this rigorous process was the development of our MVP, a thoroughly validated foundation that set the stage for the product’s next iterations that came right after on a monthly release cycle.


My learnings
Over the course of three years, I played a pivotal role in building this tool from the ground up, gaining invaluable experience along the way. As the product evolved from concept to reality, we began observing its first real-world usage—integrating real data and backend systems. This phase brought with it both significant learnings and challenges, as we navigated constraints related to budget, time, resources, and technical limitations. These years were rich with growth, problem-solving, and adaptation.
- Navigating complex challenges: I developed a deep, focused understanding of the problem space, enabling me to approach complex issues with confidence and clarity. This expertise allowed me to solve design and technical challenges efficiently.
- Iterative approach to feature development: I learned to break down features into stages, delivering what was essential first, then iterating and improving based on real user feedback and data. This lean, phased approach ensured continuous improvement and agility.
- Mastering prioritization: I honed the skill of splicing user stories and mastering feature prioritization—an art that requires balancing user needs, business goals, and technical feasibility to ensure optimal impact.
- Business communication: One of the most valuable skills I developed was learning to speak the language of business. Building strong connections with stakeholders required me to frame design and development decisions in ways that aligned with broader business goals, enhancing collaboration and securing buy-in for user-centered design practices.

The design
is never finished
As I write this case study, Insights is a live product being used by users across the globe, built from the ground up with a robust process. Yet, the question loomed: Where do we go from here? For days, this was top of mind.
This highlights an important truth: a designer’s work is never truly finished. Design doesn’t end at delivery; it’s a continuous journey of iteration, adaptation, and evolution. Products and services must grow in response to changing user needs, technological advancements, and shifting market trends. With this mindset—and feedback pouring in weekly from users—it became clear that it was time to evolve.
Together with my team, we revisited many of the hypotheses we had developed over the years, cross-checking them against the real-world feedback we were receiving. This thorough analysis allowed us to identify key areas that needed attention.
One significant issue we uncovered was with our navigation—it wasn’t working as well as we had hoped. To address this, we went back to users, setting up a tree-testing exercise to better understand their pain points. From the data we gathered, we gained valuable insights that enabled us to refine and enhance the navigation experience. Below is a small excerpt from this body of work, showcasing how continuous feedback and iteration led to a better product.

💡
This was only a glimpse
Curious to know more about the process or something else?
Get in touch with me and let’s have a chat!

